
One of the longest standing traditions in motorsports, and certainly the most important to the state of Indiana, is the Greatest Spectacle in Racing, the Indianapolis 500. Every year, 300,000 fans from all over the world convene in Indianapolis, Indiana to watch 33 racers drive 500 miles in just 3 hours – that’s an average speed of 167mph! However, the race didn’t always used to be this quick. The winner of the first race in 1911, Ray Harroun, won in 6 hours and 42 minutes – 2.25x longer than last year’s winner Will Power in 2018. Many things have led to a steady increase in lap speed including mechanical improvements, advanced materials, and enhanced safety measures. Take a look at the qualifying lap speed of every year of the Indy 500, and you’ll see a steady increase until about 1995.
Once Indy cars get above 200mph, the human body struggles exponentially to withstand with the energy of crashes, so IndyCar has passed regulations over the years in the 1990’s putting a limit on horsepower and adding more drag to the cars, slowing them down. This means that almost every car is on a much more level playing field, as their maximum speed is limited. How then do drivers stand out? These days, the winners rely on both historical data to provide a successful strategy before the race and real-time data to improve their efficiency on that fateful Sunday in May every year. Oftentimes a “great” car is only as good as the underlying data that go into a racer’s strategy.
I would love to get my hands on some real-time data to try to analyze how racing teams use a combination of tire pressure gauges, temperature probes and various sensors to decide when to take a pit stop or go one more lap, but unfortunately that’s not readily available – teams rightfully keep these secret to hold their advantage. Instead, I turned to historical data, namely last years 102nd running of the Indianapolis 500 from Indycar.com, to see what a racing amateur like me could glean from last year’s race data.
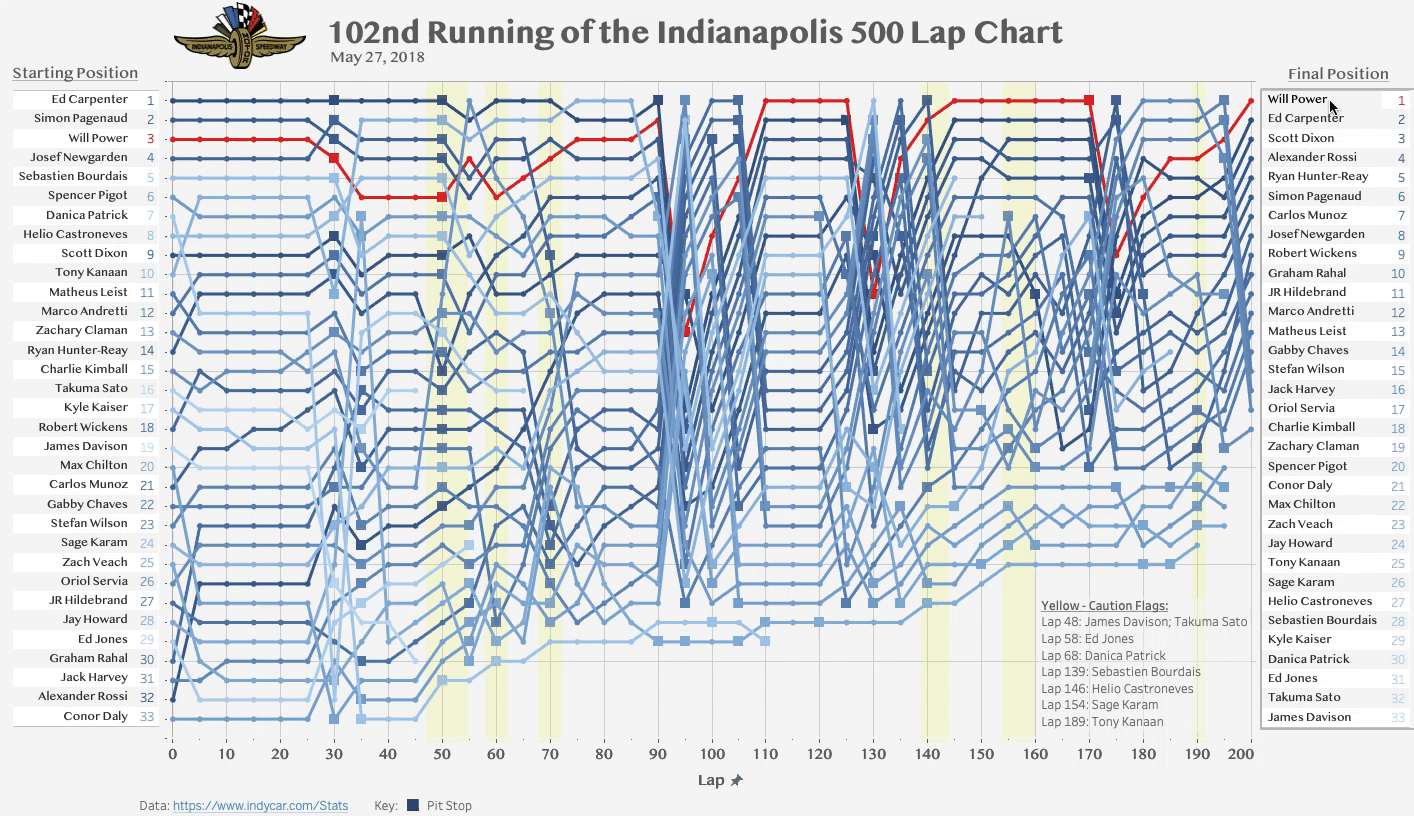
I came up with this – an interactive chart of every driver’s position during last year’s race in 5 lap intervals. On the left is each driver’s qualifying “pole” position and on the right is their final position in the race. Both of these are clickable and will highlight your favorite driver throughout the race. The winner, Will Power, is highlighted in red, and the rest of the drivers are in blue. The darker the blue, the higher they finished. The squares indicate where each driver took a pit stop, rounded to the nearest multiple of 5 (pit stops on laps ending in 3 were rounded up).
For a full desktop view, go ahead and click this link and check it out!
,https://public.tableau.com/profile/luke.labus#!/vizhome/Indy500_15571781147950/Dashboard1
Some things really caught my eye with this piece.
1. The Effect of the Caution Flag
From sources and looking at the data, Indycar drivers can get anywhere between 35-45 laps on a tank of gas depending on the car and how hard they’re racing. After the leader Ed Carpenter pitted on lap 30, the rest of the field followed. It’s clear that when James Davison and Takuma Sato crashed for a caution flag on lap 48, this set the tone for the rest of the race. Even though the cars could’ve kept going, every driver went to the pits to reset their strategy for the rest of the race.

2. Periods of Movement
The major periods of movement between laps 90-105, 125-145, and 165-185 seem to be a direct result of this caution flag near lap 50. All three of these sections are roughly 40 laps from lap 50. I’m sure it’s no coincidence that these are both the maximum tank capacity of 40 laps apart. With 150 laps left, the question for most drivers seemed to be whether they could stretch their fuel and tires for only 3 more stops in 150 laps or would they have to take an extra stop and risk losing valuable time in Pit Lane? How did the best racing teams answer that question? The top 6 finishing drivers were only took 3 more pit stops after lap 50.

3. The Case of Alexander Rossi
Alexander Rossi started in 32nd and ended up in 5th place. The key to his success looks like using the caution flags between laps 50-75 to his advantage. Whereas 7th place Carlos Munoz (-7) and 8th place Josef Newgarden (-17 positions) lost positions and 1st-3rd place drivers stayed steady, Rossi gained +10 positions during this critical time when caution restarts allow more chances for passing.
The major periods of movement between laps 90-105, 125-145, and 165-185 seem to be a direct result of this caution flag near lap 50. All three of these sections are roughly 40 laps from lap 50. I’m sure it’s no coincidence that these are both the maximum tank capacity of 40 laps apart. With 150 laps left, the question for most drivers seemed to be whether they could stretch their fuel and tires for only 3 more stops in 150 laps or would they have to take an extra stop and risk losing valuable time in Pit Lane? How did the best racing teams answer that question? The top 6 finishing drivers were only took 3 more pit stops after lap 50.

4. Willpower in the Final Laps
The end of the race gives a good visual of how important gauging your pit stops is during the race. Of the top four drivers in the race on the 195th lap, only Will Power didn’t have to pit in the last few laps. It looks like the best strategy for last year’s race was pitting earlier around lap 130, then stretching that tank of gas as much as possible to about lap 170. This strategy allowed Will Power to remain out there in the last 5 laps and cross the finish line as the winner of the Indianapolis 500.

As an Indianapolis resident growing up going to the race, this lap chart was really fun to make! It would be cool to see what insights you can gather given the lap chart of last year’s Indianapolis 500. To hear what every driver said after last year’s Indy 500, check out this post from Jerry Bonkowski from NBC Sports.
Make sure to check out everything the Indianapolis Motor Speedway has going on this week! Carb Day is this Friday, and this is your last time to see your favorite drivers practice on the track. Legends Day on Saturday features meet and greets with Indy 500 Greats by day and a Zac Brown Band headlined concert by night. And if you’re only going to go to one thing this May, definitely go to the 103rd Running of the Indianapolis 500 on May 26 to see who learns the most from their data and comes across the finish line first! I’ll see you there!